How To Read Significant Weather Prognostic Chart
Understanding weather patterns and predicting atmospheric changes is crucial for both aviation and general meteorology. Significant Weather Prognostic Charts (SIGWX charts) provide essential information for pilots, meteorologists, and weather enthusiasts, helping them anticipate critical weather phenomena that could impact safety and planning. These charts are specifically designed to depict significant weather features at different flight levels, including turbulence, icing, cloud cover, and convective activity. Learning how to read a significant weather prognostic chart enables users to make informed decisions, whether for flight planning, outdoor activities, or general awareness of changing weather conditions.
Introduction to Significant Weather Prognostic Charts
A Significant Weather Prognostic Chart, commonly referred to as a SIGWX chart, is a type of meteorological chart that highlights critical weather conditions over a broad area for a specified time in the future. These charts are produced by national and international meteorological agencies and are primarily intended for aviation purposes. They provide information on expected weather phenomena that could affect flight safety, including thunderstorms, turbulence, jet streams, and volcanic ash clouds. SIGWX charts are typically issued for two flight levels low-level charts (up to FL240) and high-level charts (above FL240), each offering different insights depending on altitude.
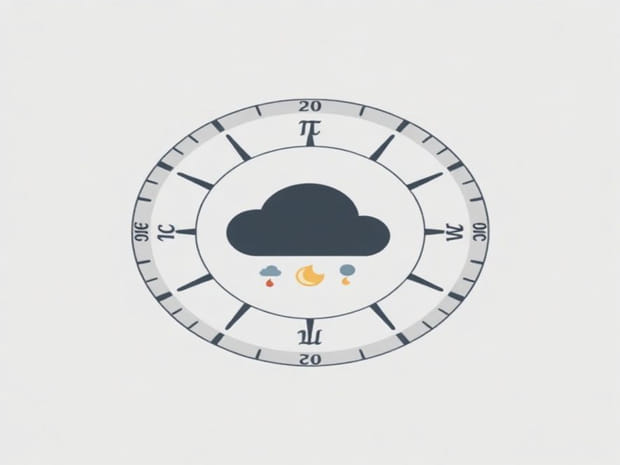
Components of a SIGWX Chart
SIGWX charts contain various symbols and annotations that represent specific weather features. Familiarity with these symbols is essential for accurate interpretation. Common elements include
- Pressure SystemsHigh-pressure (H) and low-pressure (L) systems indicate regions of atmospheric stability or instability.
- FrontsCold fronts, warm fronts, occluded fronts, and stationary fronts are depicted with distinct line patterns and symbols.
- Cloud CoverSymbols indicate areas of significant cloud formation, including cumulonimbus clouds associated with thunderstorms.
- TurbulenceAreas of moderate or severe turbulence are marked to alert pilots of potential in-flight disturbances.
- IcingRegions where icing conditions are likely to occur are identified to help aircraft preparation.
- Jet StreamsFast-moving air currents at high altitudes are indicated with arrows and associated wind speeds.
- Thunderstorms and Convective ActivityThunderstorm clusters, embedded thunderstorms, and squall lines are represented by standard meteorological symbols.
Reading Low-Level SIGWX Charts
Low-level SIGWX charts cover altitudes up to approximately FL240 (24,000 feet) and focus on weather phenomena that affect aircraft operating below this level. These charts are particularly useful for turboprop aircraft, regional flights, and general aviation.
Identifying Key Features
When analyzing a low-level SIGWX chart, users should first identify major pressure systems and frontal boundaries. High-pressure areas usually indicate stable weather, while low-pressure regions can be associated with clouds, precipitation, and potential turbulence. Fronts are essential for understanding sudden changes in wind, temperature, and precipitation patterns.
Cloud and Precipitation Indicators
Areas with significant cloud cover are typically marked with specific symbols, such as cumulonimbus icons for thunderstorms or stratiform cloud patterns for overcast conditions. Precipitation zones may also be highlighted, showing expected rain, snow, or mixed precipitation types. Understanding these symbols helps pilots anticipate visibility issues and plan alternative routes if necessary.
Turbulence and Icing
Low-level SIGWX charts often mark regions of moderate or severe turbulence. These are crucial for flight safety, as turbulence can affect aircraft control and passenger comfort. Similarly, icing zones indicate areas where supercooled water droplets may freeze on aircraft surfaces, potentially affecting lift and safety. Pilots should check these areas and adjust altitude or route planning accordingly.
Reading High-Level SIGWX Charts
High-level SIGWX charts focus on altitudes above FL240, which typically includes jet aircraft operations. These charts emphasize wind patterns, turbulence, and phenomena that can impact flights at cruising altitudes.
Jet Streams
High-level SIGWX charts prominently feature jet streams, which are narrow bands of strong wind in the upper atmosphere. Jet streams can significantly affect flight time, fuel consumption, and navigation. They are usually marked with arrows indicating wind direction and numbers representing wind speed in knots. Understanding jet streams allows pilots to plan efficient flight paths and avoid areas of potential turbulence.
Thunderstorms and Convective Activity
At higher altitudes, thunderstorms can extend vertically, affecting both low and high-level flights. High-level SIGWX charts indicate convective activity, including isolated and embedded thunderstorms. Pilots need to interpret these symbols to avoid severe weather and ensure passenger safety.
Other Weather Phenomena
High-level charts also display regions of moderate to severe turbulence, clear air turbulence (CAT), and areas where volcanic ash or significant icing might be present. Accurate interpretation of these elements helps pilots plan optimal routes and altitudes while minimizing risk.
Step-by-Step Guide to Interpreting SIGWX Charts
To read a significant weather prognostic chart effectively, it is important to follow a systematic approach
- Step 1 Identify the Forecast Time and DateSIGWX charts are valid for a specific forecast period. Confirm the time and date to ensure the information is current.
- Step 2 Determine the Flight LevelDecide whether to use the low-level or high-level chart depending on the altitude of interest.
- Step 3 Locate Major Pressure Systems and FrontsRecognize areas of high and low pressure and the positions of frontal boundaries.
- Step 4 Examine Cloud and Precipitation AreasIdentify regions of significant cloud cover and precipitation types to anticipate visibility and weather conditions.
- Step 5 Assess Turbulence and Icing ZonesNote areas marked for moderate or severe turbulence and potential icing.
- Step 6 Evaluate Jet Streams (High-Level Charts)Observe wind direction and speed for flight planning and fuel efficiency.
- Step 7 Identify Thunderstorm and Convective ActivityLook for symbols indicating thunderstorm clusters, squall lines, and convective regions.
- Step 8 Integrate the InformationCombine all elements to understand the overall weather scenario and make informed decisions for flight or travel planning.
Practical Tips for Using SIGWX Charts
Understanding significant weather prognostic charts requires practice, but several tips can make interpretation easier
- Use a legend or key to familiarize yourself with the standard meteorological symbols.
- Compare the SIGWX chart with actual METARs and TAFs for real-time weather validation.
- Pay attention to forecast validity periods to avoid relying on outdated information.
- Practice reading charts regularly to become proficient at quickly identifying critical weather features.
- Consult aviation weather guides or online tutorials for additional insights on complex symbols and phenomena.
Learning how to read significant weather prognostic charts is an essential skill for pilots, meteorologists, and weather enthusiasts. These charts provide a comprehensive overview of expected atmospheric conditions, including cloud cover, turbulence, icing, convective activity, and jet streams. By understanding the symbols, chart structure, and flight-level distinctions, users can make informed decisions that enhance safety, efficiency, and planning. Whether interpreting low-level or high-level SIGWX charts, a systematic approach to reading pressure systems, fronts, turbulence zones, and convective activity ensures a clear understanding of upcoming weather. Regular practice, combined with consultation of additional meteorological data, helps build confidence in chart interpretation, ultimately supporting safe and informed aviation and travel decisions.