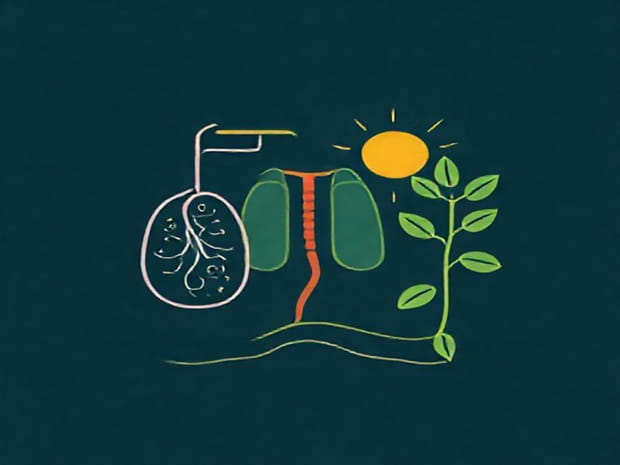
Cellular Respiration And Photosynthesis Diagram
Cells are the building blocks of life, and they rely on energy to perform essential functions such as growth, reproduction, and repair. Two of the most critical biological processes that manage energy flow in living organisms are cellular respiration and photosynthesis. These processes are interconnected, forming a cycle that sustains life on Earth. Diagrams of cellular respiration and photosynthesis are often used in biology to illustrate how energy is converted, stored, and utilized within cells. Understanding these diagrams helps students, researchers, and enthusiasts visualize the complex chemical reactions that power life.
Overview of Cellular Respiration
Cellular respiration is the process by which cells convert glucose and oxygen into energy, water, and carbon dioxide. The primary purpose of cellular respiration is to produce adenosine triphosphate (ATP), the energy currency of the cell. This process occurs in the mitochondria of eukaryotic cells and involves a series of biochemical pathways, each with specific steps and enzymes. A diagram of cellular respiration typically includes the glycolysis stage, the Krebs cycle, and the electron transport chain, showing the flow of energy and molecules throughout the process.
Stages of Cellular Respiration
- GlycolysisTakes place in the cytoplasm and breaks down glucose into two molecules of pyruvate, producing a small amount of ATP and NADH.
- Krebs CycleOccurs in the mitochondrial matrix, where pyruvate is further broken down, generating NADH, FADH2, and carbon dioxide as byproducts.
- Electron Transport ChainLocated in the inner mitochondrial membrane, this stage uses electrons from NADH and FADH2 to produce a large amount of ATP through oxidative phosphorylation.
A cellular respiration diagram usually shows glucose entering glycolysis, pyruvate entering the Krebs cycle, and the flow of electrons through the electron transport chain, emphasizing the production of ATP at each stage.
Overview of Photosynthesis
Photosynthesis is the process by which green plants, algae, and some bacteria convert light energy, carbon dioxide, and water into glucose and oxygen. This process occurs in the chloroplasts of plant cells, with chlorophyll capturing light energy. Photosynthesis can be divided into two main stages the light-dependent reactions and the Calvin cycle. A photosynthesis diagram illustrates how sunlight, water, and carbon dioxide are transformed into chemical energy and oxygen, providing a visual representation of the energy conversion process in plants.
Stages of Photosynthesis
- Light-Dependent ReactionsTake place in the thylakoid membranes, where sunlight splits water molecules, producing oxygen, ATP, and NADPH.
- Calvin CycleOccurs in the stroma of chloroplasts, using ATP and NADPH to convert carbon dioxide into glucose.
In a photosynthesis diagram, arrows often indicate the input of sunlight and water, the release of oxygen, and the production of glucose, helping viewers understand the flow of energy and molecules in the process.
Interconnection Between Cellular Respiration and Photosynthesis
Cellular respiration and photosynthesis are complementary processes. Photosynthesis stores energy in glucose molecules, which cellular respiration then breaks down to release energy for cellular activities. The oxygen produced during photosynthesis is used in cellular respiration, while the carbon dioxide generated during respiration is used in photosynthesis. A combined diagram often shows this cyclical relationship, emphasizing how energy and matter are recycled in ecosystems.
Energy Flow in the Diagrams
Diagrams of these processes often highlight energy flow. In photosynthesis, light energy is captured and stored in chemical bonds of glucose, while in cellular respiration, chemical energy in glucose is converted to ATP. Arrows and labels in the diagrams indicate how energy is transferred between molecules, showing the efficiency and direction of energy movement. Visual representation helps students grasp abstract concepts like energy conversion and chemical potential.
Molecular Details Shown in Diagrams
Diagrams often include key molecules such as ATP, NADH, FADH2, and NADPH. In cellular respiration diagrams, NADH and FADH2 carry electrons to the electron transport chain, facilitating ATP production. In photosynthesis diagrams, NADPH and ATP generated in the light-dependent reactions drive the Calvin cycle to synthesize glucose. These molecules act as energy carriers, and their roles are emphasized in both types of diagrams to show how energy is transformed and utilized in cells.
Importance of Visual Learning
Using diagrams for cellular respiration and photosynthesis aids comprehension by providing a clear visual representation of complex biochemical processes. Students can identify where inputs like glucose, water, carbon dioxide, and sunlight enter the processes, and where outputs like ATP, oxygen, and glucose are produced. Arrows, labels, and color coding in diagrams can help distinguish between different stages and molecules, making the processes easier to memorize and understand.
Common Features of Diagrams
While cellular respiration and photosynthesis have distinct processes, their diagrams often share common features
- Inputs and OutputsClearly labeled substances entering and exiting the processes.
- StagesSequential steps or cycles depicted with arrows showing the progression.
- Energy MoleculesRepresentation of ATP, NADH, FADH2, and NADPH to show energy flow.
- OrganellesIndication of mitochondria for cellular respiration and chloroplasts for photosynthesis.
Using Diagrams for Problem Solving
Diagrams of cellular respiration and photosynthesis are not just visual aids; they are tools for problem-solving. Students can use them to predict the effects of changes in substrate concentration, light intensity, or enzyme activity. For example, understanding the diagram of cellular respiration can help explain why oxygen deficiency limits ATP production. Similarly, analyzing a photosynthesis diagram can clarify how reduced sunlight affects glucose synthesis. These diagrams thus serve both educational and practical purposes in biology.
Diagrams of cellular respiration and photosynthesis are powerful tools for understanding how energy is captured, stored, and utilized in living organisms. Cellular respiration converts glucose into ATP, providing energy for cellular functions, while photosynthesis captures light energy to produce glucose and oxygen. Together, these processes illustrate the cyclical flow of energy and matter in ecosystems. By studying and interpreting these diagrams, learners can better grasp the interconnectedness of life processes, the importance of energy carriers, and the efficiency of biochemical pathways. The visual representation of these complex processes not only aids learning but also deepens our appreciation for the remarkable biochemical systems that sustain life on Earth.