How To Create A Pareto Chart In Excel
Creating a Pareto chart in Excel is a powerful way to visualize data and identify the most significant factors affecting a process or problem. A Pareto chart combines a bar graph and a line graph to show the relative frequency or impact of different categories while also highlighting their cumulative contribution. This visualization follows the Pareto principle, often referred to as the 80/20 rule, which states that roughly 80% of effects come from 20% of causes. Whether analyzing sales data, quality issues, or customer complaints, learning how to create a Pareto chart in Excel can help you make data-driven decisions, prioritize actions, and communicate insights effectively to stakeholders.
Understanding the Pareto Chart
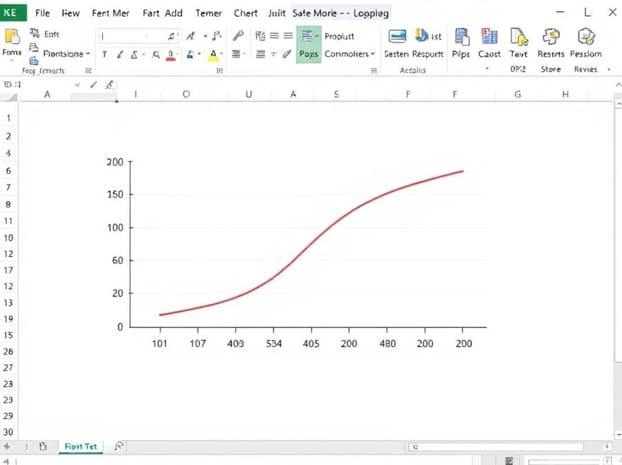
A Pareto chart is designed to identify the vital few” categories that contribute the most to a problem or outcome. The chart displays bars in descending order of frequency or impact, and a line graph represents the cumulative percentage of total occurrences. This combination allows users to quickly identify which categories are the most important and should be prioritized for improvement.
Components of a Pareto Chart
- Vertical bars representing individual category values, such as counts, costs, or frequencies.
- A cumulative percentage line showing the total contribution of the categories combined.
- An x-axis displaying the different categories, sorted from highest to lowest.
- A y-axis showing values for both the bars and the cumulative percentage line.
Preparing Data for a Pareto Chart in Excel
Before creating a Pareto chart, it’s important to organize your data correctly. Proper preparation ensures that the chart accurately reflects the distribution and cumulative impact of the categories.
Step 1 Collect and Organize Data
Gather the data you want to analyze. This may include defect types, sales regions, or customer complaints. Arrange the data in two columns one for categories and one for their corresponding values, such as counts or frequency.
Step 2 Sort Data in Descending Order
Sort the values column in descending order so that the category with the highest frequency or impact appears first. This step is essential for a proper Pareto chart, as it highlights the most significant categories at the beginning of the chart.
Step 3 Calculate Cumulative Percentage
Add a third column to calculate the cumulative percentage of the total. Use a formula in Excel, such as
=SUM($B$2B2)/SUM($B$2$B$10)
This formula calculates the running total for each category divided by the overall total. Format the result as a percentage to visualize the cumulative contribution on the chart.
Creating a Pareto Chart in Excel
Excel provides multiple methods for creating a Pareto chart, including using the built-in Pareto chart feature in newer versions or creating a combination chart manually. Both approaches allow you to effectively display frequency and cumulative percentage.
Method 1 Using the Built-in Pareto Chart Feature
For Excel 2016 and later versions, you can create a Pareto chart directly
- Select your data, including the category and value columns.
- Navigate to theInserttab and chooseInsert Statistic Chart>Pareto.
- Excel automatically sorts the data in descending order and adds a cumulative percentage line.
- Adjust chart titles, labels, and formatting as needed to improve readability.
Method 2 Creating a Pareto Chart Manually
If your version of Excel does not include a built-in Pareto chart option, you can create one manually using a combination chart
Step 1 Insert a Column Chart
Select your sorted category and value data, then insert a standard column chart. This will represent the individual values for each category.
Step 2 Add Cumulative Percentage
Select the cumulative percentage column and add it to the chart. Right-click the series and chooseChange Series Chart Type. Set the cumulative percentage series to a line chart and assign it to a secondary axis.
Step 3 Format the Chart
Format the bars and line for clarity. Add data labels to display percentages on the line graph, adjust axis titles, and use contrasting colors for bars and line. This enhances visual interpretation and ensures the chart effectively communicates the Pareto principle.
Customizing Your Pareto Chart
To make your Pareto chart more insightful and visually appealing, consider these customization options
Adjust Colors and Styles
Use different colors for bars and the cumulative percentage line to differentiate between the two elements. Consider using muted colors for minor categories and bold colors for the top contributors.
Add Data Labels
Displaying values and percentages on the chart helps viewers quickly understand the impact of each category. Use labels for both bars and the cumulative line.
Highlight the Vital Few
Consider visually distinguishing the top categories contributing to 80% of the effect. This can be done using color coding, shading, or annotations to emphasize the “vital few” categories.
Analyzing and Interpreting the Pareto Chart
A Pareto chart is not just a visual tool but also a strategic instrument for decision-making. By interpreting the chart, you can identify the most critical areas to address for improvement.
Identify Key Contributors
Look for categories that form the initial steep slope in the cumulative percentage line. These are your primary contributors and should be prioritized for action.
Assess Minor Contributors
Categories toward the right of the chart, forming the flatter part of the line, are less significant. These may not require immediate attention, allowing you to focus resources where they matter most.
Apply the 80/20 Rule
Use the Pareto principle to determine which categories represent roughly 80% of the total effect. Focusing on these top categories can lead to significant improvements with minimal effort.
Maintaining and Updating the Pareto Chart
Pareto charts are most useful when data is regularly updated. As new data becomes available, refresh the chart to ensure accurate representation of trends and priorities.
Regular Data Updates
Update the data table frequently to reflect current conditions. Recalculate cumulative percentages if values change to keep the chart accurate.
Dynamic Charts with Excel Tables
Consider converting your data range into an Excel Table. Tables automatically adjust formulas and charts as new data is added, making it easier to maintain a dynamic Pareto chart.
Use Filters for Focused Analysis
Apply filters to analyze subsets of data, such as specific months, regions, or product lines. This allows for more targeted decision-making and performance tracking.
Creating a Pareto chart in Excel is an effective way to visualize the most significant factors affecting a process or problem. By preparing your data, choosing the appropriate method, customizing the chart, and interpreting the results, you can leverage the Pareto principle to prioritize actions and make informed decisions. Regular updates and dynamic features in Excel further enhance the usefulness of the chart, ensuring it remains a valuable tool for ongoing analysis and improvement. Mastering Pareto charts empowers you to focus on what matters most, allocate resources efficiently, and communicate insights clearly to stakeholders.